Blog

  • Why Retailers Should Use Goals in Google Analytics

    Eye-candy: picture of a table football goalI got a surprise at a recent ecommerce conference.

    For the price of a coffee in the break, I offered to show people how to use Google Analytics Custom Dashboards to see all their key ecommerce goals in one place.

    I was shocked to discover that many retailers don’t have any goals set up. So there was nothing to put on that dashboard. They couldn’t take me up on my offer.

    Instead, people asked me “why do you need goals in Google Analytics if you’ve already got the transactions and ecommerce conversion rate?”

    Here’s my answer. There are many things Google Analytics goals can do. But I’ll confine myself to just one:

    Google Analytics goals can help on-line retailers increase their profits.

    That’s a big claim.

    How can goals lead to increased profits?

    Without needing to know anything about your margins, I can show you how using goals can increase your profit by reducing the cost of acquiring new customers.

    Getting new customers is vital. No matter how good your retention rate, your business will go down if you don’t attract new customers.

    But the cost of getting new customers is high and it’s often not easy to tell whether the money you spend on reaching those customers is paying off or not.

    To paraphrase a well known saying, “half the money I spend on customer acquisition is wasted, the trouble is I don’t know which half”.

    Let me explain the problem.

    When you look at your visits in Google Analytics you can instantly spot two groups of visitors without needing any goals.

    1. There’s a big group of maybe about 30% of your visitors who bounce straight off the site. They’re not interested in you right now, or they’ve seen exactly what they need to see on that page and are finished for now.
    2. There’s another very small group of maybe 5% or less who make a purchase on this particular visit. You know a lot about these people from the standard GA reports.

    But neither of these are useful sources of new customers. What about the other 65%, forming the bulk of your visitors? They didn’t buy this time, but they didn’t bounce straight off the site either.

    This group will include people who are existing customers, or people who already know about you from previous visits. You can spot these people because they have come from your emails, or they have come via a brand keyword or ‘navigation’ search.

    But it will also include people who have come from generic non-brand searches, or from referring sites, or from other forms of on-line acquisition campaigns.

    This last group are really interesting: they’re your potential new customers. You’re probably spending a lot of money on attracting these people, but since they didn’t buy anything this time round, how do you tell whether the money was wasted or not?

    Using Goals in Google Analytics will allow you to make an informed decision on which sources of potential new customers are more valuable than others.

    Which means that you can cut the money you’re wasting on sources of ‘bad’ prospects and invest your resources in the sources which are bringing you more valuable prospects.

    Which means that your cost per acquisition goes down and your profit goes up.

    How to Use Goals to Zero In on the Best Sources of Potential Customers

    • Create goals for micro-conversions on the ecommerce journey, such as viewing product details, or adding to cart and you’ll be able to identify people who are showing strong signs of intent to buy
    • Create engagement goals for people who view more than a certain number of pages. They may not be as valuable as people who reach one of the micro-conversions. But they’re more valuable than people who see only 2 pages, for example.

    Use these goals to compare different sources of visitors in the GA ‘All Traffic Sources’ report. The best view for the comparison is the ‘performance view’, so switch over to that and then use the drop down menu on the right to examine the individual goals.

    Screenshot: Google Analytics all traffic report in performance view

    This view of the report makes it easy to spot the sources which are sending you visitors with high conversion rates for these goals. You now know which sources are worth investing in. Sources which send lots of vistitors but with low conversion rates for these goals are less promising, so move your resources away from them.

    Using this technique you can get a good idea of which “half of the money” is being wasted and which is bringing you in real potential customers.

    Other Ways of Using Goals

    In this article I’ve concentrated on just one way retailers should use goals because I wanted to make it clear how you can link this approach to profit.

    But of course there are plenty of other reasons why ecommerce sites should use goals. Here are some related articles on the subject

    Checkout Funnel Reporting

    The classic ecommerce funnel and goal report is the one for the checkout. This report is used to monitor the performance of your checkout system and learn which stages are causing your customers problems and possibly costing you sales. Here’s a power-user tip: for day to day monitoring of your checkout you can create a custom dashboard showing the checkout abandon rates from each stage of your checkout.

    Error Reporting

    Every error your visitors see is like a slap in the face. You’re investing money in getting people to your site. That money is wasted if the visitors have a bad experience. So you should smooth the path to the cash desk by sweeping errors out of the way. Using goals for error messages is a great way of seeing where your customers are having problems. This approach means you can even use GA Intelligence Custom Alerts to let you know when there’s something wrong and maybe even suggest the cause.

  • Get an Instant Checkout Health-check With This One-stop Report

    Screenshot showing Google Analytics Dashboard with Checkout Abandon RatesSee if anything is wrong with your checkout at a glance with this Google Analytics Custom Dashboard.

    Important Update: September 2012 – Combine all data in one chart

    If you have an ecommerce web site you know that the performance of the checkout is critical. If anything goes wrong with the checkout it will be costing you money.

    That’s why first thing every morning, before I even look at the sales figures, I look at my clients ‘Checkout’ custom dashboards.

    It gives me an instant health check. I can clearly see if something has gone wrong with any of the stages in the checkout, such as the payment gateway or the address lookup system. Or if something is wrong with a promotional offer codes and people who use it are unable to buy…

    All I have to do is to take a quick look at this one-stop dashboard to see if any of the ‘sparkline’ charts has an unusual looking spike. I can instantly see if something is out of line, and exactly which part of the checkout has a problem. I really like reports like these. They’re what I call ‘read and react‘ reports.

    Using Google Analytics to Monitor Checkout Abandon Rates at Each Stage (mp3)

    Build a report like this and you’ll find it’s very powerful. You may already have read enough to know what to do, but I’ve explained how to do it below. Follow these instructions and you will be able to spot if there’s anything odd happening with your checkout by looking at one clear report.

    Which means that… You can jump in and fix the problem before too much money has been lost.

    How To Make Your Read and React Checkout Dashboard

    The secret of this technique is to set up a sequence of Google Analytics funnels, one for each stage, and then build a dashboard showing the abandon rate for each of those funnels.

    Screeenshot: how to set up Google Analytics goals for horizontal funnel from LunametricsThe idea of using a series of separate funnels has been around since 2010.

    The technique is called building a ‘horizontal funnel’ and is mostly used to allow you to use segments with funnel abandon data. This idea was recommended in a Lunametrics article by John Henson: http://www.lunametrics.com/blog/2010/06/04/segment-goal-funnel-google-analytics/ [link opens in a new tab]

    The original concept involved using a Google Analytics Custom Report to present the information in a way which made all the important numbers easy to see, but it did not include any visualisation of the abandon rate from the different stages.

    But now we can use GA Custom Dashboards to show all the individual abandon rates, trended over time, on a single screen.

    Being able to spot the changes in the trend compared to normal performance adds the final touch which transforms ‘detailed analysis’ data into a ‘read and react’ operational report. You also get a bonus of being reminded of the relative abandon rates from the different stages so you can see where the friction points are.

    Each time you look at this dashboard you can see what’s going on in a split second. You can instantly tell if you need to fix anything.

    At peak periods it’s a good idea to check back later and set the date range to include ‘today’ so you can keep an eye on things.

    Once you’ve tried this technique you can apply it in lots of ways. In the example here, I’ve extended the concept to show some extra very useful data which is relevant to checkout problems.

    Screenshot: Checkout GA Custom Dashboard

    In the first column I’ve got the ‘alarm bell’ step by step abandon rates. These are all ‘metric’ widgets which include the sparklines trend charts which are the key to this technique. I’ve arranged the widgets in order of the likelihood of trouble, not the real life order of the stages. You can just drag and drop them to suit your preference.

    The middle column contains a ‘table’ widget which might also provide evidence of something odd, or at least interesting, going on with the checkout. It shows the overall checkout abandon rate by source/medium of the visit. I find it useful to be constantly aware of how some channels bring visitors who are far more motivated to make it all the way through the checkout than others.

    In the third column I’ve got some ‘line chart’ widgets because they allow me to compare two metrics. In this example they are comparing the abandon rate from just the cart page with the abandon rate for the rest of the checkout. Or the abandon rate from just the cart page with the abandon rate of the checkout as a whole.

    You could extend the idea behind the middle ‘table’ widget further. For example, on many sites it would be useful to have another widget showing the abandon rates from just the cart page, broken down by source. If your cart page contains an offer code box, for example, a sudden spike in the cart page abandon rate from one source is a strong indication that there’s probably a ‘bad’ code being promoted there. In that situation you can either create an extra version of the code which matches the one which people are trying to use, or try to promote the correct code via the same source.

    In the video below you’ll see me building another variation on this layout. Once again the first column contains the ‘alarm bell’ sparklines, but the table widgets in the middle can be used to gain a wide range of operational insights which you can use to modify or correct promotional campaigns straight away.

    You can include up to 12 widgets on each dashboard. What you choose to show in the tables should be decided on the basis of what you’re actually putting your resources into now. This is a living dashboard: you should change it to align with what matters now and what you can still change.

    Can you see the theme there? This dashboard is not just a read and react tool for spotting technical errors. It’s also a very useful tool for getting an understanding of the motivation of the visitors from different channels. The biggest variations in checkout performance, in my experience, have very little to do with the technicalities of the site and everything to do with the strength of people’s desire to buy. Persuasion and motivation can have more influence on abandon rates than the position or wording of the ‘checkout now’ button.

    The original Lunametrics post gives you excellent instructions on how to set up the sequence of funnels.

    And this video shows how to use those funnels in a custom dashboard like the one above:

    The example shows the abandon rates from a Magento one page checkout, as reported using the GoogleAnalyticsPlus Magento plugin from Fooman.

    Updates on Checkout Abandon Rate Dashboards in Google Analytics

    [September 2012] Major Update: Combine all your checkout abandon rates into one chart!

    One of the problems with dashboard widgets is that you can’t control the y axis scale. This means that there’s no easy way of making a visual comparison if the abandon rates from different stages are widely different — for example 40% from the cart page, but 5% from delivery options.

    An interesting way round this is to use the abandon rate data from your ‘horizontal funnels’ outside of GA itself, using the GA API.

    Here’s an example of a chart which:

    1) Uses the same y axis scale for all the abandon rates
    2) Combines them all in one chart (even better)

    Example of google checkout abandon rates by stage combined in one chart

    For full instructions on how to do this see this Google Analytics blog post:

    http://analytics.blogspot.co.uk/2012/08/automate-google-analytics-reporting.html

    and here’s the video version

    The metrics you need will be something like

    ga:goal1AbandonRate,ga:goal2AbandonRate,ga:goal3AbandonRate,ga:goal4AbandonRate

    where the goal number matches the actual goals you have configured on your site.

    [January 2012] Someone has just pointed out that it can be extremely useful to look at checkout abandon rates by browser for each stage. At the moment there’s no easy way to do this in the dashboard itself. You can’t use Advanced Segments in dashboards. And even if you could, you really need to be able to segment by browser version, not browser, as this screenshot shows:

    screenshot: google analytics cart abandon rate by browser

    Having to configure each segment first and only being able to see four browser versions at a time would make using segments tedious, even if it was possible.

    So the way I do this is to configure the widget to link through to a Google Analytics custom report containing a tab which allows me to see the abandon rate broken down by browser and then by browser version. I also have a tab showing a source/medium breakdown, which is the one I use more often.

    You can import an example of such a report into your own GA profiles by logging into GA and then clicking this link:

    https://www.google.com/analytics/web/permalink?type=custom_report&uid=pmQVC9ZyRj6SYJ565Eu9kA

    This example shows the rates for two goals (14 and 15 in this case) so that it can be used as the link from two widgets. That suits the way I work. This is intended as an example to get you started: you must edit the report to show the goals which you have configured in the relevant profiles.

    Resources for Horizontal Funnels and Custom Dashboards

  • How Multi-channel Funnels Give You More Insight Than Ever Before

    Screenshot: SEO Keyword Grouping GA Multi Channel FunnelsUpdated: March 2012

    Multi-channel Funnel Reports in Google Analytics bring us a whole new depth of understanding to how people come to web sites over the course of several visits.

    Now we can see how some channels are more valuable than we thought up to now. They’re helping make sales which are being credited to something else.

    And there’s a bonus: we can also start working with our SEO keywords and other sources of traffic with a level of control which was previously only available for paid advertising and other campaigns.

    In real time. Retrospectively. With no pre-configuration effort (so not like campaigns, then).

    The most stunning of these reports, in my opinion, is the Top Conversion Paths report. For the first time ever it shows the history of a series of visits.

    What’s more, it groups them by channel so that you can see the most common sequence of routes to the site. For example: social, followed by search, followed by email.

    What’s even more, you can create your own custom groupings which means that you can start working with your organic search keywords in groups, like ‘head terms’ and ‘long tail’ or ‘brand’ and ‘generic’, just as you would with paid search. Or you could group your social sites according to different types, or separate different classes of referring sites, and so on.

    The standard groupings include things like:

    • ‘Paid Search’ — PPC advertising
    • ‘Display’ — banners etc
    • ‘Other advertising’ – other paid advertising
    • ‘Organic search’ — unpaid search visits
    • ‘Social’ — Facebook, Twitter and a long list of other social sites (take a look)
    • ‘Referral’ — referred visits
    • ‘Email’ – visits where the medium has been tagged as ’email’ (exact)

    This allows for a very powerful summarised view of the pattern of visits like this:

    Screenshot: Google Analytics Top Conversion Paths report

    But this default view only scratches the surface of what you can do with these reports.

    The real power lies in the fact that you can create your own custom groups. The interface for doing this is great and you can (should!) use the basic groupings as a template to get you started.

    The first thing I would do is to split those ‘Paid Advertising’ and ‘Organic Search’ groups down so that you can separate searches for your brand keywords from generic searches for more general terms. Those are two hugely different types of search.

    In order to get new customers you need to be able to clearly understand the steps which someone takes from doing a generic search for something you supply through to the point where they know about you and your brand.

    At this point I should pause and thank Matt Trimmer at iVantage who pointed out that Custom Channel Groupings has the facility for doing exactly what we need.

    Here’s an example of what such a report looks like. This is much more revealing than the default version.

    Screenshot: Separate Brand and Generic Search Groups in Top Conversion Paths

    Suddenly it’s obvious that most of the search visits are from people who already know about the brand. Generic search doesn’t appear until much lower down the list.

    The Custom Channel Groupings interface makes it very easy to copy and then edit the basic group configuration.

    The slowest part of the process is working out what your brand keyword variations are. There are full instructions in an earlier article on How to Start Working with Brand Keywords in Google Analytics

    Once you have your list of keywords it’s all point and click from then on. This 6 minute video shows you what to do:

    Separating brand from generic search is the first thing I would do with these reports. But the potential to go further is huge. This approach means that you can start working with groups of unpaid keywords in the same way as you do with paid keywords. For example, you can start breaking those generic search terms down into ‘head’ and ‘long tail’ groups.

    Things to Watch Out For with Multi-channel Funnels

    • You have to have goals or ecommerce configured for these reports to work
    • The default view takes all goals into consideration. I think it’s better to be selective about which goals you are reporting on, particularly if you have many micro-conversion goals set up. For most ecommerce sites, I would tend to consider the ecommerce transactions on their own and then look at key micro-conversions separately. It stands to reason that you might get a series of micro-conversion visits before a final transaction visit, so you need to keep them separate.
    • These reports only work with goals configured and they only show visits with goals. But goals could include non-bounce visits if you so wished.
    • Experiment with the drop down menu which allows you to choose whether to see all the visits, even if they only have one step, or more than 2, and so on. The ‘more than’ options are the most interesting when you are looking for patterns. But don’t treat those as the default or you risk missing the fact that only some visits have any history at all.

    That last point is an absolutely critical one. The history of multiple visits is based on cookies. People now use multiple devices to visit sites and some systems also delete cookies, which means that many real-life returning visitors are counted as new visits by Google Analytics and all cookie-based systems. So what we have here is a sample. These reports provide much more insight than we have had up to this point. We can now see the history of a series of visits. But it’s not the complete picture: this is great for assessing relative numbers  and trends, but the actual numbers should only be treated as indications.

    Resources Relating to Multi-channel Funnels

    Here’s a beginner’s introduction video from Google:

    There’s a more serious one here: http://youtu.be/rZ2RbGsuy3U [Opens in new tab]

    [Other good sources are appearing all over the place at the moment, so I will continue to update this list.]

    Updates

    • [March 2012] Google have introduced new standard channel groupings in Google Analytics. I think it’s wise to take a look at the actual definitions (start to create a new custom set based on the standard definitions, but don’t save). You may find that some of them won’t work for you. For example I work with clients who use several variations of medium for their email campaigns, such as ’emails’, so the standard exact match for ’email’ is no good. A ‘contains’ match would be better for them. Here’s the official guide to the standard Google Analytics Channel Group definitions.
    • [November 2011] The introduction of secure search by Google means that a growing proportion of organic search visits do not have any keyword information. These will show as ‘Not Provided’ in your keyword reports. Since you do not know whether these searches were for ‘Brand’ or ‘Generic / Non-Brand’ terms, it now makes sense to add a third organic search Channel Group for ‘Not Provided’.
  • Download Custom Report to Compare Days of the Week in Google Analytics

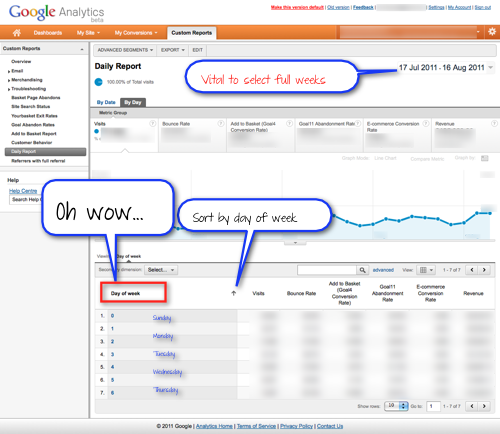
    Screenshot: Google Analytics Daily Report by Day of WeekHere’s a great custom report for you to try. There’s a link below to import the report straight into GA, but first let me explain why I think this is so exciting.

    Retailers and other web sites with strong weekly visitor patterns need to be able to compare Mondays with Mondays and Saturdays with Saturdays.

    Comparing the same day of each week over a long period is also very useful for any site planning emails or any other form of on-line campaigns.

    So I was really excited when a comment on Linked In from Mike Sullivan of Nextanalytics provided me with the key to doing this.

    Although I’m a huge fan of Custom Reports, for some reason I had not noticed that ‘Day of Week‘ is available as one of the dimensions.

    In v1 of Google Analytics you used to be able to select all the ‘Mondays’ in a month by clicking on the top of the column in the calendar. But you could only do one month at a time and even that ability disappeared in later versions. It became necessary to do this kind of reporting outside of GA using Excel or a dashboard client.

    Now you can do it all in a custom report, so I’ve made an example ‘weekday‘ report which you can download using a link at the end of this article.

    Using Custom Reports is so much better and allows you to experiment with using secondary dimensions at the top level of the report. ‘Dimensions’ is the GA word for ‘what the data is that you’re looking at the numbers for’ — the information in the first column of the table. Dates or Days in this case. So you could add the source/medium for each day next to it in a second column, for example.

    But first take a look at this standard version:

    Screenshot: Google Analytics Custom Report by Day Tips

    But my favourite view at the moment is to use ‘Day of Week’ as the top level dimension, and then drill down to ‘Date’. By using Custom Reports you can add a new tab to view the data that way round:

    Screenshot: Google Analytics Custom Report by Day of Week

    I’ve added the names of the days to the screenshot so you can see what’s happening. The report just shows the number of the day: 0 for Sunday, the first day of the week and 6 for the last day, Saturday.

    This version of the report means you can see the average figures for all 7 days of the week compared to each other over an extended period. You can then drill down to see how each of the ‘Tuesdays’ compare with each other. That’s the insight which interests me most. The chart also updates to match, so you can choose whether to leave it with a single spike for one day each week, or change to ‘Graph by week’ view to see a continuous line.

    Screenshot: Google Analytics Comparison ViewThese reports work really well in ‘Comparison View’ and ‘Performance View’, so be sure to experiment with those. But I’ve discovered that you can’t sort by the day of the week when you’re using that view, so you’ll need to be careful. There have been changes to the sorting functions during the last few weeks (weighted sort appeared and then disappeared), so this situation may well change.

    How to Make a Day of the Week Custom Report in Google Analytics

    The simple clue that ‘Day of Week’ is available as a dimension will have been enough for some people.

    If you’d prefer to see how it’s done, I’ve made a 5 minute video showing each step.

    Or if you’d prefer to save some time, use the link below the video to import a copy of the report and then edit it to match your business needs.

    You’ll see in the video that I ran up against a problem when I went for overkill and tried to include all 20 goals and a load of extra ecommerce metrics. I was doing that because I thought it would be helpful to make a report which would work for everyone no matter which goals they use.

    The final report does not include the final few goals, but you can download it into your own GA and see for yourself. Have a play with it and edit it to suit.

    How to Import the Days of Week Google Ananlytics Custom Report

    1. Log into GA
    2. Click this link: [opens in new tab] to import the report
    3. Don’t forget to scroll down to choose your profiles and then click save!

    Things to Watch Out For

    When you’re doing this kind of comparison it makes sense to use a date range which includes full weeks

    If you’re using the ‘View by Day of Week’ approach it is vital to choose full weeks

    The default sort order in GA is based on the first column of metrics in the data. I always repeat ‘visits’ in each metric group because it’s important to always be aware of the size/significance of the group of visits you’re looking at. But in these reports you will almost certainly want to sort by the dimension, not the metrics (the date or the day of the week). Don’t forget to click at the top of the dimensions in the table to change the sort order.

    In the screenshots I’ve added the names of the days of the week. GA just gives you the numbers! 0 is your first day of the week, 6 the last.

    Resources Relating to Custom Reports and Days of Week

    Before you go, please give one of these sharing buttons a click:

  • Learn the Secret Power of Google Analytics Custom Alerts

    Abstract photograph of light shining on wallHere’s a quick way to get Google Analytics to shine a light on problems on your site and help you sort them out. You can also use this tip to spot promising sources of new customers and other good news like that.

    In the practical example you’ll learn how easy it is to set GA to alert you when new visitors are landing on a 404 (“Page Not Found”) error page and give you a one-click route to the source of the problem so you can head over there and fix it.

    That’s powerful stuff. If someone comes to your site and all they get is an error they may not give you a second chance.

    To adapt a well-known analytics phrase: “They came, you slapped them in the face, they left”. So a quick fix for these problems is very valuable indeed. Using this approach, GA gives you a great way of sorting things out fast.

    Once you’ve tried this very practical example, you’ll probably find that you want to apply the same method to other key events on your site, including good ones. It’s and easy but powerful technique — let Google Analytics do some of the tricky work for you!

    The secret is to combine micro-conversion goals with GA Custom Alerts. The hidden super-power of this combination is that it uses the cleverness of Google to give you clues as to ‘why’ something unusual has happened, not just to flag up the fact that it ‘has’ happened.

    First I’d like to thank @mattycurry for really driving this point home in a @boagworld podcast I heard a while back.

    Example: How to Spot and Fix Broken Links from External Web Sites

    Use this simple technique to make a “Read and React” report for spotting accidentally broken links from external web sites. In the age of user-generated-content there’s a lot of this about. I often see it with links being posted in forums on voucher or coupon code sites.

    Using Custom Alerts I can not only see that there’s been a sudden increase in 404 pages:

    Screenshot: Google Analytics Custom Alert Lightbox Overlay

    But GA also provides me with an instant analysis of the source of these visits:

    Screenshot: Google Analytics Custom Alert Major Contributors

    And, since these visitors are being referred from another site, there’s also a handy button to take me to the referring page with the dodgy link. So I can click straight over there and try to sort things out.

    In short: GA tells me something’s wrong, suggests what the cause may be and even helps me on my way to providing a fix. Nice.

    How to Set Up a Custom Alert Based on a Goal

    The first thing you need to do is to make sure that your 404 page is being tracked in Google Analytics. I’ve written about this already in another post, which also contains an interesting discussion in the comments about how to get the best out of error tracking if you’re starting from scratch. But this time round I’ll assume that you can identify your 404 page as either a pageview or an event in Google Analytics.

    Once you know how your 404 page is being tracked, you need to set up a Goal for it in Google Analytics.

    The next thing to do is to set up a Custom Alert based on that Goal. It’s true that GA will show you automatic alerts for unusual Goal data without you needing to configure anything. But I currently recommend using a Custom Alert for two reasons:

    1. Custom Alerts allow you to fine tune the timing and scale of the change which will trigger the alert
    2. Custom Alerts generate the oh-so-helpful ‘Major Contributors’ report

    Here’s a video showing you how to do those two stages:

    And that’s it.

    Now all you need to do is check the Google Analytics Intelligence reports each day and watch for those alerts. When you spot one, look at the “Major Contributors” then click through to the source and try to fix the problem. If it’s something someone has posted in a forum you’ve got a golden opportunity to sort out the problem and generally demonstrate your willingness to listen and to help.

    I’ve seen discussions with broken links to a promotional offer start to turn hostile because people assume that the offer has been suddenly withdrawn. This situation is a classic example of where you can turn the impression of your brand all the way from negative, through neutral, and right round to positive just by showing up and being helpful. You can rescue thousands of visits by using this technique if you move fast and handle things well.

    Final point on ‘what to do’ — don’t forget to add a Google Analytics Annotation to note what happened:

    Screenshot: Google Analytics Annotation for Custom Alert

    Why You Shouldn’t Rely Just on Email Alerts

    To repeat one point from the video: at the moment I think you need to check the reports rather than rely on the automatic email and SMS alert options.

    The Intelligence processing takes time and (in my UK time-zone) those emails don’t arrive until more than a day after the trouble began. With this particular alert you need to react as quickly as possible.

    In fact I also add the 404 Page Goal Conversion Rate to my morning dashboard so that I can spot anything nasty as soon as I start work. I use a desktop dashboard client which is configured to include the current day as well as the last last month so that I can spot what’s happening in almost real time. That’s good in case something really bad is happening. But then I need to do some manual work right away to track down the source because I don’t have access to that handy one-click route via the “Major Contributors” report.

    Use the Custom Alerts and Goals Combination Again and Again

    The example I’ve given above is a very specific and practical one which should be relevant to many sites and which can help you take action to fix something which is broken.

    You can also use the same technique to tell you when something good is happening and suggest why.

    For example: you may well already have a Goal set up for the “Add To Cart” micro-conversion. This approach could point you at the source of an unexpected increase in purchases.

    Better still, if you have a goal which matches the start of a “new customer” checkout, the “Major Contributors” report could alert you to a promising new referral source of business. This is the kind of thing you might not normally see buried in all the campaign activity to recruit new customers.

    Google Analytics Intelligence is a really powerful tool for spotting things that you may not be actively monitoring. It shows you things you weren’t looking for. You can take a look at that unexpected source and see if there’s anything you can do to get more of those people interested in you. In the age of social networking, simply showing up and showing you care can bring big rewards. Intelligence Alerts can help you take an interest in things you would not normally have noticed. Give it a try!

    Resources Related to Using Google Analytics Custom Alerts and Goals