Blog

  • Getting new customers, listening to them and getting them signed up — ecommerce ideas and advice from the last week

    Customer acquisition was the theme for the snippets I posted on Facebook last week. (20/20 hindsight mode reveals.)

    I think that John Jantsch’s idea of the customer journey as an hourglass, rather than a funnel, is an extremely powerful way of thinking in the age of social marketing. It places as much emphasis on what happens after someone has bought as on getting them to buy in the first place.

    In the middle of the week I saw a very useful article explaining some of the ways in which insights from ‘voice of the visitor’ surveys can be used to improve acquisition as well as customer retention. Next day one of the key vendors announced a major improvement in their budget survey tool which transforms it in to something you should consider for use on an ecommerce site. (20/20 hindsight mode also suggests the appearance of these two items was possibly related!)

    Finally there were a couple of technical items. One was exciting and upbeat: the thought that single sign-on using Facebook, Twitter, Google etc might herald the end of agonising over whether to ask people to register for checkouts. The other was critical but tedious: some serious guidance on how to react to the changes in the UK cookie law.

    Read on, or use this list to jump to the item you want:

    Powerful new way of thinking about customer acquisition journey

    John Jantsch’s ‘Marketing Hourglass’ concept is very powerful. It starts with getting people to ‘know’, ‘like’, and ‘trust’ you. Then you move on to ‘try’ and ‘buy’. But the most powerful components are the next stages: ‘repeat’ and ‘refer’. That last one is the key to real growth. But you have to succeed in all the previous stages to get there.

    Hourglass customer journey picture Understanding the Most Fundamental Shift in Marketing
    www.ducttapemarketing.com
    Marketing Hourglass explained by John Jantsch (Click to play or right click and Save As to download – Subscribe now via iTunes or subscribe via other RSS device (Google Listen) When I want to make marketing extremely easy to understand, I sit small business owners down in front of the above graphic
    http://www.ducttapemarketing.com/blog/2011/04/21/understanding-the-most-fundamental-shift-in-marketing/

    Huge improvement in visitor survey system from 4Q

    If you need to know why people are coming to your web site and what they think about it, it’s time to take a fresh look at the 4Q survey system. Two key changes mark a leap in quality, I think. 1) The survey invitation is now far less intrusive (the previous version was an instant turn-off for some people) 2) You can now use the interface to add your own categories to comments and to flag them.

    At the moment I don’t think the category and the tag data are included in the data export files, but that ought to be fixable. So you can now analyse your data much more effectively. In my experience, this kind of survey is the secret weapon for site-improvements. You’ll get more insight, quicker, than by frowning at Google Analytics reports. Ideally you’d combine the two. And, in fact, you can!

    Thumbnail showing new features in 4Q voice of visitor survey system4Q Suite has a Ton of New Features! – Turn Up The Silence
    blog.iperceptions.com
    A digital platform for iPerceptions employees to voice personal thoughts and opinions about web analytics, online research, and much, much more…

    http://blog.iperceptions.com/2011/05/4q-suite-is-live/

    Why listening to the voice of the visitor is so important

    Anyone who’s worked with me knows how important I think voice of customer surveys are. I’ve gained more actionable insights out of them than any other source. Let people tell you what they need, what they think about your site and what’s broken. This article is a long read, but it contains lots of useful insights. The interview is with one of the vendors, but the ideas could be applied using any survey system.

    Logo: Smart Data CollectiveMeasuring the Strong Signal of the Customer’s Voice | Smart Data Collective
    smartdatacollective.com
    SDC interviewed Claude Guay – CEO of iPerceptions – and Duff Anderson, iPerceptions’ VP of research – about their approach to gathering essential data about customers. What data is most important, and what is most reliable? iPerceptions provides customizable survey tools for businesses ranging from

    http://smartdatacollective.com/clifffigallo/36298/measuring-strong-signal-customer-s-voice

    Why single sign-on may mark the end of checkout registration debate

    I suspect that the debate about whether ecommerce sites should ask people to register may be over sooner than we think. The switch towards using common sign-ins with credentials provided by Facebook, Google, Twitter and the rest will become an avalanche. This article shows which systems are used on which types of site and compares the data returned to each site.

    Graphic: pyramid jigsawHow People Sign In to Online Services [Infographic]
    www.readwriteweb.com
    We have any number of ways to sign in online. Brian Madden points out it’s an ever-more-complicated concern as the concept of the desktop changes and we grapple …

    http://www.readwriteweb.com/solution-series/2011/05/password-security-online-robbe.php

    Good to see that my friends at Screen Pages have shared some guidance from a law firm on the new UK cookie laws. The law comes in to effect next Thursday. There’s also an interesting discussion thread growing on Brian Clifton’s authoritative analytics blog: http://www.advanced-web-metrics.com/blog/2011/05/20/google-analytics-and-the-new-eu-privacy-law/

    Logo: screenpages.comCookies on e-commerce websites: latest guidance for new EU laws
    www.screenpages.com
    Cookies on e-commerce websites: latest guidance for new EU laws: e-commerce news & tips from Screen Pages.
    http://www.screenpages.com/ecommerce/archives/000671.html

    If you like this kind of thing, please don’t forget to click the ‘Like’ button on the next line:

  • Quick Reads: Social Media, Google Analytics and Persuasive Copywriting

    Screenshot of CxFocus Facebook PageDo you struggle to keep up to date? I spend at least half my working hours trying to keep my eye on the latest developments in ecommerce. When I come across something interesting I usually mention it on Twitter. You can see my Twitter feed in the right column of the CxFocus blog.

    But 140 characters can be just a bit too short for me. So I’m also experimenting with posting items on the CxFocus Facebook Page, because that allows a bit more space and includes different media. It’s also great for discussion of course!

    Below is a summary of what I posted last week. The main themes were: the language of persuasion (or the opposite!), social marketing and Google Analytics.

    What attracts consumers to take part in social media campaigns?

    This post is worth reading for the comment from someone working at Nokia — if you’re using Facebook well and have the right kind of approach you don’t need to get involved with offering prizes or fussing with terms and conditions. Good content rules, yet again — and that applies when the content is from visitors too.

    Econsultancy logo
    What attracts consumers to take part in social media campaigns?
    econsultancy.com
    I’ve been asked a few times recently how social media users behave over different channels, and I thought it was worth jotting down some notes on what to expect if you’re running a campaign that includes user-generated content.

    Make your instructions clear and your help helpful with these great tips

    Micro copy (those instructions and pop-ups on forms) and error messages are one of the things which can make a site easy to use or a complete pain. This article contains lots of great examples. And it’s fun to read too. How rare is that in our working lives? As a bonus, here’s a link to a Flickr Group devoted to the same subject full of screenshots of good and bad examples:
    Mailchimp user exists

    ideas word cloud
    24 ways: The Construction of Instruction
    ?24ways.org
    The advent calendar for web geeks. Each day throughout December we publish a daily dose of web design and development goodness to bring you all a little Christmas cheer.

    Sell more with more persuasive language – tips from a top copy-writer

    Find out how you can improve the sales from your site with just a few quick changes to the wording of key pages.

    Mel Henson portrait from www.smartinsights.com
    Copywriting tips from Mel Henson > Smart Insights Digital Marketing
    www.smartinsights.com
    I met Mel Henson at last year’s ECMOD conference where we discussed the pleasure and pain of book writing. She was hard at work on a new book on copywriting

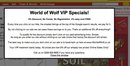
    How not to do it: example of wordy overlay on landing page

    This overlay appeared after I had clicked through from an advert on Facebook. “VIP Specials!” sounds good, but there’s way too much text.

    Screen Grab showing overlay asking people not to click paid links

    Screen Grabs

    CxFocus There’s a video showing what happened here:
    http://www.cxfocus.com/index.php/ecommerce-usability/click-multichannel-reporting-incentive-click/

    Learn GA Best-practice with external Google Analytics audits from L3

    Any retailer who wants a quick insight into the kind of thing they could and should be doing with Google Analytics should follow this series of audit reports from L3 Analytics. In fact, I think they’ll do one on your site for free if you ask!

    Screenshot of Whistles site from L3 Analytics

    Whistles GA Flash Audit | Web analytics consultancy and expert Google analytics | L3 Analytics
    www.l3analytics.com
    by Peter O’Neill on May 10, 2011 in GA Flash Audit

    CxFocus I’ve just realise that it would be better to give a link to the list of all the audits. It also includes an introduction: http://www.l3analytics.com/category/ga-flash-audit/

  • Don’t click here? Multi-channel reporting triggers incentives not to click…

    Site-owners are starting to learn more about the series of sources which people use to visit sites over time.

    Will this widespread introduction of data on cross-session attribution lead to some panic reactions, as retailers count the cost of multiple clicks and plead with customers:

    “Please DON’T click our ads”

    Take a look at this short example of an ecommerce merchant offering a discount if you don’t click on any more paid advertising:

    It’s a safe bet that we’re going to see a lot more of this kind of thing as more companies get a glimpse of how many times they may have paid various marketing channels for the same order.

    It used to be the case that this information was only readily available if multiple affiliates were claiming commission on the same order (and then only if you had time to actually check), or if you could afford one of the expensive analytics systems.

    But in 2011 multi-channel attribution data is becoming much more widely available.

    The data is very far from 100% complete. As more of us use more different devices to visits web sites, the chances of all our visits being recorded in one set of cookies is getting more remote. It’s been estimated that each of us has 4 such sets of cookies on the go [source: econsultancy article by Matthew Tod]. Some solutions put a lot of effort into trying to stitch all those sessions together [e.g Intellitracker’s single view of the contact].

    But there’s no need for that kind of accuracy unless you’re trying to target individuals. What we’re being offered may be sampled, but it’s good enough to confirm what has often been said before: a purchase may come at the end of a series of repeat visits via different channels [source: econsultancy article by Paul Cook]. This is not news. It’s common sense.

    Knowing something in theory is one thing, however, and seeing the data from your own site is another. Especially when it’s your budget paying for each of those clicks.

    So I can see a rash of attempts like this to try to STOP people clicking on all those links.

    But hold on there…

    Nothing has actually changed. Our reports are just showing us a bit more about what was already happening.

    It has always been like this. Our on-line advertising spend was being distributed in ways which may not have been so easily understood before. But these are the ways which the sophisticated players who could afford the tools and the people to use them already knew about.

    • Like the big-budget sites, more of us can now fine-tune our spend in those areas
    • We can invest more in trying to get people to the site by means which don’t cost as much as affiliate links and PPC brand advertising

    But we’re not going to get people to click and buy in a single visit just because we’d like it to work that way!

    I would suggest shifting some of those budgets towards loyalty schemes, email, SEO and social rather than overlays to slap people in the face when they land on the site. The fundamental principles of persuasion and usability still apply.

    Off-line we’re all used to running a mix of campaigns through different channels in the expectation (hope!) that people will see several of them, often several times each (!) and finally make a purchase. The same is true on-line. And now more of us have even better opportunities to get detailed insight on this, IF we have the resources to analyse it thoroughly.

    So we can manage it better. But we still probably find that we end up paying for several clicks before the final sale.

    For my money, the quick return on investment comes from another load of data which Google Analytics is making available right now.

    The Site Speed reports are offering insight on something which very few companies bothered to pay for up until now. But site speed matters to customers. Site speed makes a difference to whether real people will even try to buy things from your site as well as whether they manage to do so.

    If you want a real competitive advantage over your rivals, I would head for the site speed reports and fix the pages which have problems, while your competition agonise forever over attribution models. You’ll be making your site better for your (probably mutual) potential customers while competitors are squabbling with PPC and affiliate account managers.

    Notes

    The site in the video
    Far from being involved in an early pilot on any new Google Analytics features, the site in question is part of the shrinking chunk of the web which does not have GA installed.

    It only seems fair to give www.worldofwolf.co.uk a good link. The site looks like a good place to check out if you want to buy Wolfe Garten garden tools in the UK.

    As I said in the video: it would be extremely interesting to know if running the overlay has had any effect on the bounce rate. Received wisdom says that something like that overlay with its wall of text would be a real slap in the face. But real life experience often proves ‘received wisdom’ wrong. Maybe the mention of “VIP” in the overlay headline will counteract the complexity of the message.

    Site Speed Matters

  • How to start working with brand keywords in Google Analytics

    Wordcloud showing brand keywords
    Separating your ‘Brand’ searches from ‘Generic’ searches will help you measure and improve your customer acquisition and retention programs.

    Consistency is important here if you are to make and track changes over time. So this article explains the starting point for using this information in a systematic way in Google Analytics.

    As a bonus, the process itself may also reveal a hidden ‘long tail’ of Brand keyword variations which you did not know you had.

    What are ‘Brand’ Keywords

    Brand keywords are the words which people use to search on Google (or other search engines) when they are specifically trying to find your company’s site or products.

    The obvious examples are the name of your company, your brand, or the actual address of your web site.

    Plenty of people enter web site addresses into Google instead of typing the address into their browser. This is perfectly sensible behaviour. Google will automatically take care of typing mistakes. And these days Google’s “Instant Search” will probably bring up the correct result after you’ve typed the first few letters. So it’s a quick and easy way of getting to a site.

    This form of searching is often called “navigational search”.

    The less obvious examples are when someone searches for a product name or other word which is so closely associated with you that it is as specific to you as your actual brand or company name.

    Why Brand Keywords are different

    When someone uses a brand keyword to search for your site it is obvious that they already at least know your name.

    Their intention is also fairly clear. It’s reasonable to assume that they wanted to find your site: they searched for your brand and clicked on a link to your site.

    You cannot assume that all these visitors have been to your site before (unless GA shows them as a returning visitor). Their awareness may have been created by off-line experiences or promotions or other forms of on-line activity.

    But it’s also common for Brand searches to be used by people who are relatively new to you, but have conducted some earlier Generic searches while in reseach mode. Brand search can indicate someone who is well down the bigger sales funnel and is close to becoming a customer, as well as existing and loyal customers.

    The key point about brand keywords is that they indicate that the visitor already knew of your company to some extent. You would expect a different pattern of behavior compared to visits which began with a non-brand or ‘generic’ search.

    A very specific example of the difference is that you would expect to see much stronger performance from paid search and also better ecommerce conversion rates from both paid and organic Brand search. The paid search click through rates, cost per click and return on advertising spend are likely to be much better than Generic search and so they should be managed and reported on separately.

    Which are better, ‘Brand’ or ‘Generic’ visits?

    This is a classic “it depends” question!

    If you get a lot of visits starting with a Brand search then you could take this as an indication that people are conscious of your brand. That’s wonderful: your name is in people’s minds and they are searching for you. This is a great indication of ‘Brand Awareness’ and you may well want to track this. This is very valuable information if you’re doing a lot of off-line promotion or on-line social marketing, both of which may be building awareness without actual clicks to the site.

    If you get a lot of visits starting with a Generic search then that indicates that your site is probably ranking well in the search engines for those terms and that your site’s title fields and descriptions are attractive enough for people to click through to your site. That’s also wonderful: it means you might be able to acquire new customers who have not yet heard of your brand.

    So the answer is, indeed, “it depends”. More of both types of visit would be very welcome, of course.

    In my experience of working with medium sized ecommerce sites operated by multi-channel retailers with significant catalogue and high street businesses, it’s common to see a lot of Brand search and not so much Generic search. So in these cases I think it’s more encouraging to see an increase in Generic search.

    But if your brand is not so well established, and you do not have such powerful off-line promotional channels, you might be more interested in seeing the level of Brand search going up.

    How to use inline filters to build a Brand Keyword list

    The starting place for this process is the normal Google Analytics ‘Keywords’ report in the ‘Traffic Sources’ area.

    When you first load this report, the chances are that you will see variations of your obvious brand terms filling the top part of the table.

    But the aim of this process is to also identify the many variations on your brand terms which may be in use alongside the obvious ones.

    So I recommend increasing the date range to make sure you have a decent representative sample. It’s also a good idea to increase the number of rows being displayed in the table so that you are able to scan a good number of keywords.

    Screen shot showing where to find inline filter in Google Analytics v4

    You need to build a list of words which can be used in a filter to match all your brand terms. The best way of doing this is to use the ‘inline filter’ at the bottom of the keyword table.

    At the time of writing, the ‘Advanced’ inline filter function only allows you to build up filter patterns which contain a series of ‘and’ matches. This is unlike the similar interface for ‘Advanced Segments’ which allows for ‘or’ matches as well. So, although it’s reasonable to bet that at some point the Advanced Inline filter will also allow for ‘or’, right now you have to use the old method.

    The old (current) method is to build up lists using the ‘pipe’ symbol: ‘|’, which is treated as ‘or’ by the system. This symbol appears as the shifted ‘\’ key on most keyboards, but its location varies. It’s bottom left on my PC and over on the right near the ‘return’ on my Mac.

    The process is to start with the first most obvious keyword variations such as

    ‘brand’ and, for example, things like ‘mybrand’, or ‘my-unique-product-name’

    which would be represented by

    brand|mybrand|my-unique-product-name

    • Start by filtering the keywords so that they ‘include’ only words which match
    • Check that nothing which shouldn’t appear is in there
    • Then switch to ‘exclude’ those words
    • Look through the new list and find other examples which are actually brand terms
    • Add them to the list with | in between each one
    • Switch back to ‘include’ view
    • Check that nothing which shouldn’t appear is in there
    • Toggle back again
    • Repeat until you feel you’ve got the main list

    This process is much easier to show than to describe in print. So this video may make it easier for you to understand:

    Once you understand the process you will probably find that you can shorten your list by editing it down to versions of the keywords which match more variations in one go. But be careful when doing this in case you ‘catch’ more than you want.

    Once you’ve build up the list, make a permanent copy of it which you can cut and paste whenever you need it. It’s a very important list and you will be able to use it again and again in many different ways.

    Ideas for using your Brand Keyword list

    Once you’ve created your list of Brand Keywords you can use it to gain a much better and consistent understanding of these two key groups of search visitors: those who already know of you and the generic searchers.

    Examples of places where you can use this list in Google Analytics include:

    • Custom Segments: one for Brand search, the other for Generic Search
    • Segmented Profiles: use ‘Include’ filters based on your list to create profiles showing only Brand search visits and only Generic search visits. (Hint: this last one can be a real eye-opener and provide a frightening glimpse of how your site performs for people who are not already familiar with your company.)
    • Rolled-up Reports: use advanced filters in an extra ‘Rolled Up’ or ‘Summarized’ profile to overwrite all the actual keywords which match your Brand keyword list with something like ‘a Brand Search’. This can allow you to keep the volume of Brand search in mind but also pay more attention to the detail of Generic search. Without this kind of rolling-up, the Generic terms can easily get lost in the crowd of Brand keywords.
    • Multi-Channel Funnel Custom Channel Groups: I’ve written a specific article about how to work with your brand keywords in Google Analytics Multi-channel Reports.

    Resources Relating to Using Brand Keywords

  • Let Google Analytics tell you when your visitors are having a bad experience

    Screen shot of Classic Facebook error messageIf you want to know what to do to make your site better for your visitors, you need to know what they find bad. And one of the best indicators that someone is having a bad time is if they keep seeing annoying error messages.

    Why error messages are a shortcut to improving customer experience

    Most error messages are triggered when someone is trying to do something, even if it’s only to click a link to a page which isn’t actually there.

    So these people are already starting to engage with your site. And then they get a slap in the face.

    Many error messages tell the visitor that they have done something wrong. It’s their fault.

    These people may start to feel frustrated and possibly annoyed by your site.

    That’s why it’s such a good idea to track error messages. They provide a very direct source of information about where your site is tripping people up and causing friction.

    I say “your site” because it is probably the site’s fault not theirs. If people are entering the wrong information, or skipping required fields it’s often because the language or signposting on the site is weak.

    OK: a typing mistake is a typing mistake — that’s the visitor’s fault, isn’t it? Fair enough. But if a lot of people are having trouble there, ask yourself: “do we really need that field, have we ever actually used that information”. Look at the exit rate from that error message and judge whether the information is worth it.

    So: error messages are a great source of actionable insight on the exact points of friction on your site. The action is simple: do what you can to reduce the errors. I’d actually set up goals and measure the conversion rate.

    The snag?

    Error messages are seldom page views, apart from the 404 “page not found” page.

    Error messages often take the form of text and highlighting which indicates the ‘bad’ entry in a form (good). Others are just ugly alert boxes which pop up in the face of the visitor, with a beep, telling them they’ve screwed up, not telling them where, and waiting to be dismissed (not so good). Neither of those would normally register as a page view, so a web analytics tool like Google Analytics will know nothing about them.

    What you need to do is add extra tracking code which is fired whenever the error message is shown. At the moment I favour using virtual page views for this in Google Analytics.

    Why use virtual page views to track errors

    There is an argument to say that errors should be tracked as ‘events’ not pageviews because they are an interaction on the site, not an actual page view. That’s debatable: the visitor certainly saw something!

    Actually, when you track these you may find that some errors are repeated again and again. This is classic evidence to suggest that the visitor might not even have noticed the error message — for example a list of form errors in small red text displayed at the top of the page, way above the submit button down at the bottom of the screen. The visitor’s eyes will be looking where they just clicked. Tip: compare the pageviews and unique page views for errors to identify errors which are seen several time by the same person:

    Screen shot from GA Content Drilldown report showing multiple views of same error message

    The real reason I favour virtual page views in GA is that, at the moment, only page views will appear in funnel reports as ‘abandon routes’ on the right side of the screen. Error messages in a checkout process would be a classic reason for abandoning a checkout. That’s something you definitely want to know about. So it’s best to have the information where you need it: in the checkout funnel report.

    [Update March 2011: The version of Google Analytics released in March 2011 introduced the ability to use ‘Events’ as goals. This may be more appropriate for many error messages. There’s a link to an article giving instructions on using Events at the end of this post. However Events do not appear as abandon routes on the right side of GA Funnel Visualization Reports so the argument for using a virtual page view in this context remains valid.

    Update May 2014: I’ve changed my advice on this over the years. I think that the case for ‘events’ is now stronger than ‘pageviews’. For example events can now be seen mixed in with pageviews in the Behaviour Flow report. The case for ‘pageviews’ depends on two things: the fact that there’s an ‘exit rate’ calculated metric available in the behaviour/content reports and because virtual pageviews will appear as abandon routes on the right side of the Funnel Visualisation report. If you want the best possible data, the solution is to use both!]

    Using either events or page views means that it is easy to configure the error messages as goals so that you can easily monitor the conversion rate. For example, I use a desktop client to monitor the conversion rates on the error goals across several sites. Each morning I can see at a glance if something is going wrong.

    How to choose a pageview structure to get the best from the content drilldown report

    I recommend structuring the page views carefully. I currently use a path for the virtual page view like:

    /errors/checkout/deliveryoptions/’the error message’
    /errors/checkout/payment/’the error message’
    /errors/emailsignup/’the error message’

    and so on.

    [Update: But see the very helpful comment from Rob Kingston below, who recommends starting all virtual pageviews with something like /virtual/errors/etc so that you can exclude them from some profiles.]

    This allows me to configure goals which consolidate groups of errors in a way which makes sense by matching the first part of the page name.

    This approach also means that the Google Analytics Content Drilldown Report works very well and becomes a power tool for digging into the errors.

    Configuring the last part of the page view as the actual text from the message makes things easier when coding but also has the added benefit that the reports show what we actually ‘said’ to the visitor. Simply seeing a list of all the unfriendly things we threw back at people, and how often, can be a wake up call.

    Once you have this information, the first thing to do straight away is to fix the error messages if they are a bit on the harsh side. And then get stuck into working out why people are seeing them in the first place.

    As usual, GA will help you prioritise. I would start by looking at the ones which happen most often and which are associated with higher exit rates.

    Switching to the Google Analtics ‘performance view’ of the data is a great way of comparing those exit rates. In this example, postcode problems stand out as a sore point:

    Screen shot showing Google Analytics performance view of exit rate from error

    Information like this is like gold dust when you’re trying to find exactly where to concentrate your efforts to give maximum benefit to your visitors.

    But please apply your knowledge of the site processes when you look at the abandon rate. The error message where people are leaving may turn out to be at the end of a series of other messages. Reducing the preceding errors would be the key to happier visitors. Custom segments might be useful here. Look at people who saw (or exited from) a particular error and see what other errors they also saw.

    As is always the case when working in web analytics, you need to have to be inquisitive and use your skill and experience to gain the real insights. But those error messages certainly provide a very clear starting point and possibly a wake up call.

    I’ll leave the question “How come all those people had a problem with their own last name?” hanging in the air for now!

    Direct Performance have taken this idea even further by coming up with a solution for using Google Analytics to track Javascript errors. Their article contains report examples, detailed instructions and sample code.

    This approach does involve making changes to your main tracking code, but it looks well worth the effort to me. Javascript errors can be a real problem for your visitors — the site simply does not do what you intend it to do and the visitor gets a crude message over which you have no control. So spotting those errors and fixing them would be a great contribution to user experience.

    http://www.directperformance.com.br/en/javascript-debug-simples-com-google-analytics

    I’ve written a separate blog post on Using Goals and GA Custom Alerts for automatic email alerts about errors.

    Updates

    March 2015:
    Mailchimp have a great blog post about their decision to remove social sign-in buttons which includes some very interesting data. In particular, they reveal that working with errors and copy had the biggest impact on reducing sign-in problems: [Opens in new tab] http://blog.mailchimp.com/social-login-buttons-arent-worth-it/

    May 2014: In January 2014 I gave a talk on this subject which included examples of some custom reports based on this data. One day I’ll add some of those here as they contain some compelling examples of lost orders from within checkouts which result from unusual errors.

    For now, here are the slides. They were created for an international audience so they include a lot of text for people who could not keep up with what I was saying, which means you can probably get a good understanding of the presentation now just from the slides.

    The slides also cover the ‘events’ vs ‘virtual pageviews’ question. These days I think the way to go is ‘errors’ but probably with duplicate tracking via virtual pageviews just to allow for inclusion in GA Funnel Visualisation reports and to get the oh-so-useful ‘exit rate’ calculated metric. Meanwhile the ability to create segments which track visitors across multiple sessions has opened up an interesting new area for studying the longer term effects of errors.

    This version skips right to the section showing example custom reports which are so useful for identifying the errors which are costing most in lost orders. In my experience you will often find there are some surprises in the list. And they may be fixable.

    You can import the checkout errors custom report shown in the slides from the GA Gallery here:
    https://www.google.com/analytics/gallery/#posts/search/%3F_.viewId%3DnHpEBtURS5-v1hUGfeh8xg

    November 2012: Peter O’Neill has written a great example explaining how to use GA Custom Variables for error tracking. He’s included a couple of Custom Reports to download too. Whether you use virtual pageviews, custom dimensions, or events, the main point is the same: work out where your visitors are having problems and try to make things better! http://www.l3analytics.com/2012/11/21/tracking-errors-with-web-analytics/ [Opens in new tab]